GCM Help Pages
Before you start
Computing GCMs
Viewing GCMs
Interpreting GCMs
Advanced
More Help
Viewing GCMs
After successful computation of a set of GCMs, the results can be viewed in the Overlay Granger Causality Map Dialog, found under the Plugins->Overlay Granger Causality Maps... menu. Any .gcm file written during computation can be loaded into the Overlay GCM dialog.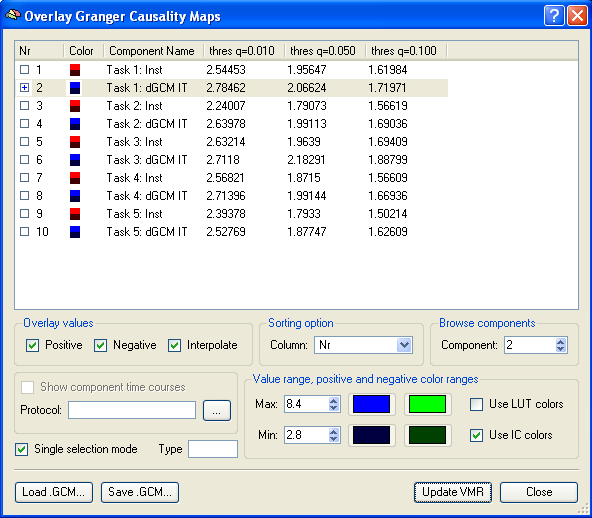 |
| The GCMPlugin Overlay Granger Causality Maps dialog |
A .gcm file will generally contain all the computed GCMs for all specified conditions for a single reference VOI. The name of the reference VOI is in the filename of the .gcm file, along with a user-specified prefix. When loaded into the Overlay GCM dialog, all computed GCMs will be listed and each can be viewed by selecting it (when 'Single selection mode' is on). Each map is named using the convention '<Condition>: <GCM_type>', where <Condition> refers to the user specified set of VTCs and intervals that the map was computed from, and <GCM_type> specifies which Granger causality component (or composition of components) is in the map. <GCM_type> can be any of (see Advanced):
- Ref2Vox
- Vox2Ref
- Inst
- dGCM
- dGCM IT
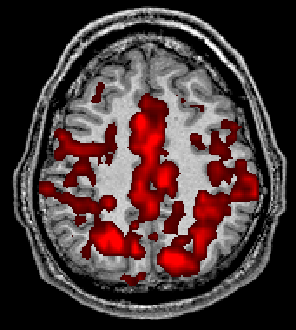 |
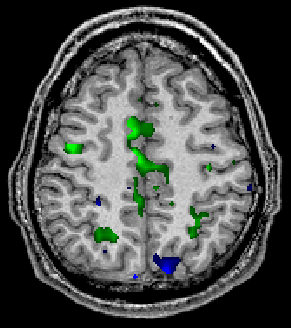 |
| An Inst GCM map | A dGCM IT map |
All GCM maps are scaled in magnitude. This is only for convenience and visualisation purposes. The natural values of the computed measures generally lie in the 0.01 range. The scale-factor is used to put them in a more 'intuitive' range, that works better with display and thresholding routines in BVQX. By default, the scaling factor is 100 (see Advanced). Thresholds for GCMs are computed by non-parameteric bootstrap procedures. Bootstrapping of p-values is done by finding the fraction of more extreme values in a surrogate NULL-distribution. The NULL-distribution is created by recomputing each term for each voxel with a simulated NULL-reference (from an AR model estimated on the real reference). The False Discovery Rate (FDR) based procedures are used on the bootstrapped p-values to give thresholds that are adjusted for multiple comparisons within the map. By default, the GCMPlugin computes thresholds for all maps at q-levels of 0.01, 0.05, and 0.1. The three thresholds for these FDR-levels are listed behind each map in the overlay GCM dialog. At selection, the map is thresholded at the most critical (0.01) level. You can adjust the threshold freely to lower levels, but only the ones listed have fixed FDR-controlled levels. The q-levels that are computed for each map can be set by the user (see Advanced). Because a surrogate NULL-distribution is resimulated and recomputed at every run of the plugin, the precise value of the threshold at a given q-value might vary slightly, even for the same map and the same reference VOI. The variations will not be large and should not lead to differences in significance, unless very critical thresholds (0.01 and below) or very noisy data (especially the in reference VOI) are involved.